A friend of mine recently commented about the downturn in the Western Australian economy and how slowly the population was growing. In 2016-17, Western Australia's population grew by 0.8%, which was half that of the national average. This is a noticeable turnaround from just a few short years ago, when the demand for labour on mining projects helped drive population growth to the highest levels in the country. Population growth and change in Western Australia has longed been tied to ebbs and flows in the mining sector. How has this played out over time?
Population growth in Western Australia, 1901-2017
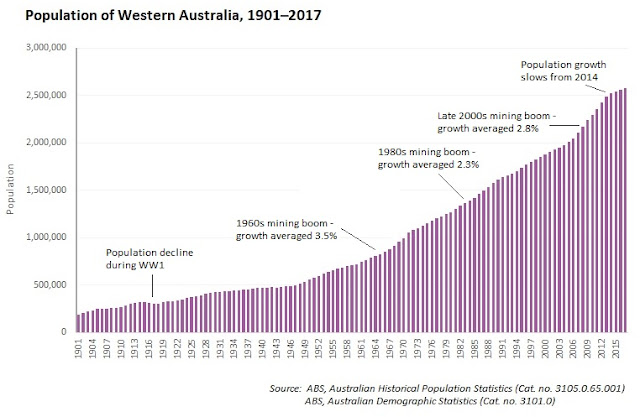
The chart below shows the population of Western Australia (WA) between 1901 and 2017. As expected over a 116 year period, there is some volatility in the level of growth. Most notably, population growth has surged during periods of strong economic growth and mining booms.
The graph shows that since the end of WW2 the population of WA has grown dramatically, with faster periods of growth roughly correlating with mining booms in the 1960s, 1980s and more recently in the 2000s. During the 1960s, when iron-ore production increased, population growth in WA averaged around 3.5% per annum. Growth peaked at 4.3% in 1968-69, and in 1970-71 the population of WA reached 1 million persons.
Population growth in WA was above the national average from 1971 through to 2013. There were stronger periods of growth during the 1980s mining boom, particularly in the late 1980s when the Australian economy was quite strong and overseas migration was relatively high. In 2004-05, the WA population reached 2 million. It took just over 30 years to reach the second million compared to over 140 years to reach the first.
From 2006, population growth in WA surged once again as mining projects in the north of the state opened up significant opportunities for employment during their construction phase. Though a significant proportion of the workforce was "fly-in fly out" (or FIFO), the data clearly shows that population growth from interstate and overseas migration increased. This suggests that despite the high mobility of the workforce that some did relocate to WA. Between 2006 and 2013, the population growth rate was at 2.0% per annum or higher, peaking at 3.2% in 2008-09.
The key difference between the most recent mining boom and those in the past has been the volume of growth, even though the rate of growth is similar. Between 2006 and 2016, more than 508,000 people were added to the population. This compares with around 336,000 people in the ten years to 1991, the period covering the boom years of the 1980s. Between 2007 and 2013 the volume of growth was more than 50,000 per annum, far exceeding the peak of 43,270 persons added to the population in 1987-88.
Dominance of Perth
The settlement pattern in Australia has been described as one with primate cities, ie where the largest city is many times larger than the next sized city. This is certainly characteristic of WA. In 2016, the population of Greater Perth was 2.02 million, compared to the 74,100 recorded for the Bunbury Urban Area (which also includes surrounding suburbs and towns) - more than 27 times larger!
Perth has been the capital of WA since 1829, but it hasn't always dominated the population of the state. This is a legacy of the rural settlement and economy of Australia, with historically larger populations in rural areas responding to labour requirements on farms and in country towns. As the economy has shifted over time, Perth's share of the WA population has continued to increase - even accounting for changes in boundaries. In 1901, Perth comprised 37% of the WA population, and by the 1940s this had reached 50%. As the need for labour on farms declined, and the economy became more focussed on urban areas through jobs in manufacturing and service industries, Perth's share of the WA population continued to increase. This has occurred despite the mining booms described above which did direct a lot of investment into remote mining areas, and towns such as Karratha and Newman were established. By the early 1990s Greater Perth's share of WA's population reached 75%, and this had reached 79% by 2016.
Summary
WA's population has been below the national average since 2014, coinciding with reduced labour requirements in the mining sector. History shows that population growth in WA does have some correlation with mining booms, with stronger growth in the 1960s, 1980s and 2000s. As the state capital, Perth has always been the largest city, and is many times larger than Bunbury. With a 2016 population of just over 2 million, Perth now comprises 79% of the WA population.


A few years ago travelling to Perth it was all boom and no-one would believe it wouldn't last forever. Now, suggest that they might still grow a bit and they're surprised! Currently losing 12,000 people p.a. interstate and only gaining about the same in international migrants. So natural growth is the only population growth in WA right now. Just came back from Port Hedland though and the amount of iron ore going through there is phenomenal. It's not stopping them from losing population. There's talk of automating the trains so they won't even need a driver!
ReplyDelete